

At its core, the inventory turnover ratio calculation is simple: just divide your Cost of Goods Sold (COGS) by your Average Inventory. But don't let the simplicity fool you. This one number is a powerful health check for your retail operations, revealing how many times you’ve sold through your entire stock in a given period.
What the Inventory Turnover Ratio Really Tells You

Think of your inventory turnover as a speedometer for your business. It's not some dusty figure on a balance sheet; it measures your sales velocity and operational efficiency all at once. A high ratio? Your products are flying off the shelves. A low one means stock is sitting idle, tying up cash and taking up precious space.
This single metric gives you a surprisingly deep snapshot of your business's health. It tells you about:
- Sales Performance: Are your products actually in demand, or are they just collecting dust? A strong ratio is a great sign that your sales and marketing efforts are hitting the mark.
- Inventory Management: It shows how well you're walking the tightrope between meeting customer demand and avoiding costly overstocks or frustrating stockouts.
- Cash Flow Health: Faster turnover means cash isn't locked up in unsold goods. Instead, it’s flowing back into the business where you can reinvest it.
The Story Behind the Number
To really get it, picture a busy grocery store. The turnover for perishable items like milk and bread is incredibly high because it has to be. Those products come in and are sold within days.
Now, contrast that with a high-end jewelry store, where a luxury watch might sit in the display case for months. Both businesses can be highly profitable, but their turnover ratios tell completely different stories about their models and customer cycles.
This is the most important takeaway: what's "good" is entirely relative. A turnover ratio of 4 might be fantastic for a furniture retailer but would spell disaster for a grocer. That’s why you have to understand what the number means within your industry. Comparing your ratio against sector benchmarks is the only way to get a true read on your performance. Diving into https://www.electronicshelftags.com/big-data-for-retail/ can give you the data needed for these crucial comparisons.
Your inventory turnover ratio isn't just an accounting figure—it's a direct reflection of your purchasing decisions, marketing effectiveness, and overall market demand. It’s the pulse of your operational efficiency.
To break it down even further, here are the core ideas in a nutshell.
Key Concepts at a Glance
| Concept | What It Is | What It Reveals About Your Business |
|---|---|---|
| Cost of Goods Sold (COGS) | The direct costs of producing the goods sold by a company. | The raw cost of your inventory before any markup. |
| Average Inventory | The average value of inventory held over a specific period. | A baseline of how much stock you typically keep on hand. |
| Inventory Turnover Ratio | The number of times inventory is sold or used in a time period. | How quickly you are converting stock into sales. |
This table helps you see how each piece of the puzzle contributes to the final picture of your operational health.
Context Is Everything
Your inventory turnover has a direct line to your working capital and, ultimately, your profitability. It's no surprise that companies with best-in-class inventory processes consistently outperform their peers.
For example, a company like Otis Worldwide reported a turnover ratio of 7.2 in a recent quarter. Meanwhile, many fast-moving consumer goods companies in emerging markets often see annual turns in the 5–8 range. These numbers show just how much performance can vary by industry, driving home the need for context.
To truly grasp the significance of your inventory turnover, you need to see it as part of a bigger financial picture, alongside other critically important KPIs that together tell the full story of your company's profitability and efficiency.
Let's Walk Through the Calculation

To really get a handle on your inventory turnover, you just need two core numbers from your books. The good news? You don't need a degree in accounting to find them.
The formula itself is pretty simple:
Inventory Turnover Ratio = Cost of Goods Sold (COGS) / Average Inventory
Essentially, you're looking at how much you spent on the products you actually sold compared to the value of the inventory you typically have sitting on your shelves. Let’s break down how to get both of those numbers.
Finding Your Cost of Goods Sold (COGS)
First, you need to pin down your Cost of Goods Sold, or COGS. This number represents the direct cost of creating or buying the products you sold during a certain time frame. It’s a powerful metric because it cuts through the noise of other business expenses and zeroes in on what you paid for the inventory that moved.
So, what goes into COGS?
- Raw Materials: The cost of the base components for products you manufacture.
- Direct Labor: Wages paid to the people who are hands-on in production.
- Supplier Costs: The price you paid for finished goods you bought to resell.
It’s just as important to know what not to include. Things like marketing spend, your accountant's salary, or the cost of shipping to a customer don’t belong in COGS. Tossing those in would inflate the number and throw off your whole calculation.
Nailing Down Your Average Inventory
Next up is your Average Inventory. It might seem easy to just grab the value of your inventory on a random day, but that’s a rookie mistake. A single snapshot can be really misleading—it doesn't capture the natural ebb and flow caused by seasonal rushes, big supplier orders, or unexpected shipping delays.
To get a number that truly reflects your business, you need an average calculated over the same period as your COGS. The go-to method is:
Average Inventory = (Beginning Inventory + Ending Inventory) / 2
This simple average smooths out the peaks and valleys, giving you a far more reliable picture of your typical stock levels. Getting this right is critical for a meaningful inventory turnover ratio calculation. Many modern tools, like advanced shelf tracking systems, can automate this for you, keeping your inventory data precise and current.
Using an average inventory value is non-negotiable for an accurate calculation. It prevents a single high-stock or low-stock day from skewing your results and misrepresenting your operational efficiency.
Putting It All Together: A Quick Example
Let’s make this real. Imagine you run "Bean Haven," an online store for specialty coffee beans, and you want to check your inventory turnover for the last quarter.
- Pull Your COGS: After checking your financials, you find that the total cost for all the coffee you sold over the quarter was $40,000.
- Figure Out Average Inventory:
- At the start of the quarter, your inventory was valued at $12,000.
- By the end of the quarter, it was $8,000.
- The calculation is: ($12,000 + $8,000) / 2 = $10,000.
- Calculate the Ratio:
- Inventory Turnover = $40,000 (COGS) / $10,000 (Average Inventory)
- Your ratio is 4.
A ratio of 4 means Bean Haven sold and replaced its entire inventory four times during the quarter. Not bad. And while this ratio is a fantastic tool, getting a complete financial picture is always smart. It’s a good idea to also master other crucial financial metrics like margin calculations to truly understand your profitability.
Interpreting the Story Your Ratio Is Telling

Alright, you’ve crunched the numbers and you have a result. So what? An inventory turnover ratio is just a number until you understand the story it's telling about your business.
At first glance, a high ratio looks fantastic. And it often is! It usually points to strong sales and products that your customers love. But if it’s too high, it can be a red flag. You might be running too lean on inventory, which puts you at risk of stockouts. Nothing frustrates a customer more than not being able to buy what they came for.
On the flip side, a low ratio is almost always a sign of trouble. It suggests your shelves are filled with products that aren’t moving, tying up precious cash that could be used elsewhere. This slow-moving stock isn't just sitting there; it's actively costing you money in storage, insurance, and potential obsolescence.
Finding Your Industry Benchmark
Here’s the thing: a "good" turnover ratio is completely relative. A 2 would be a disaster for a grocery store but perfectly fine for a dealership selling luxury cars. Context is everything.
To get a real sense of your performance, you need to see how you stack up against others in your field. This is where benchmarks come in.
- Trade Associations: These are gold mines. Your industry’s association likely publishes reports with financial benchmarks and key metrics.
- Business Databases: Services like Dun & Bradstreet or IBISWorld provide deep dives into industry data, though you’ll often need a subscription.
- Public Company Filings: Check the annual reports of your publicly traded competitors. Their financial statements are a great place to see their turnover rates.
Comparing your number to these benchmarks is what turns a simple metric into a powerful competitive insight. It’s a non-negotiable step in any serious inventory turnover ratio calculation.
Think of your inventory ratio less as a final grade and more as a diagnostic tool. It tells you exactly where to look next, whether that’s a potential stockout risk or a cash flow problem hiding in your warehouse.
This metric really does vary wildly. For example, fast-moving consumer goods might see turnover ratios well above 10, while businesses selling heavy machinery could be looking at a healthy 2-3 turns per year. You can dig into more examples of how turnover ratios differ across sectors on TheGlobalEconomy.com.
Decoding High vs Low Inventory Turnover
To help you get a quick read on your business's health, I've put together a simple table. This breaks down what a high or low number could signal.
Decoding High vs Low Inventory Turnover
| Ratio Status | What It Could Mean (The Good) | What It Could Mean (The Bad) |
|---|---|---|
| High Turnover | Your sales are strong, products are in demand, and your marketing is working. | You have insufficient inventory, you're constantly risking stockouts, and you're likely leaving sales on the table. |
| Low Turnover | Your purchasing is disciplined, and you have a solid safety stock for key items. | You're overstocked with dead inventory, sales are weak, and your cash flow is getting squeezed by high carrying costs. |
Getting this interpretation right is one of the most crucial inventory management best practices you can master. It’s how you turn raw data into a real strategic advantage.
Actionable Strategies to Improve Your Turnover Rate
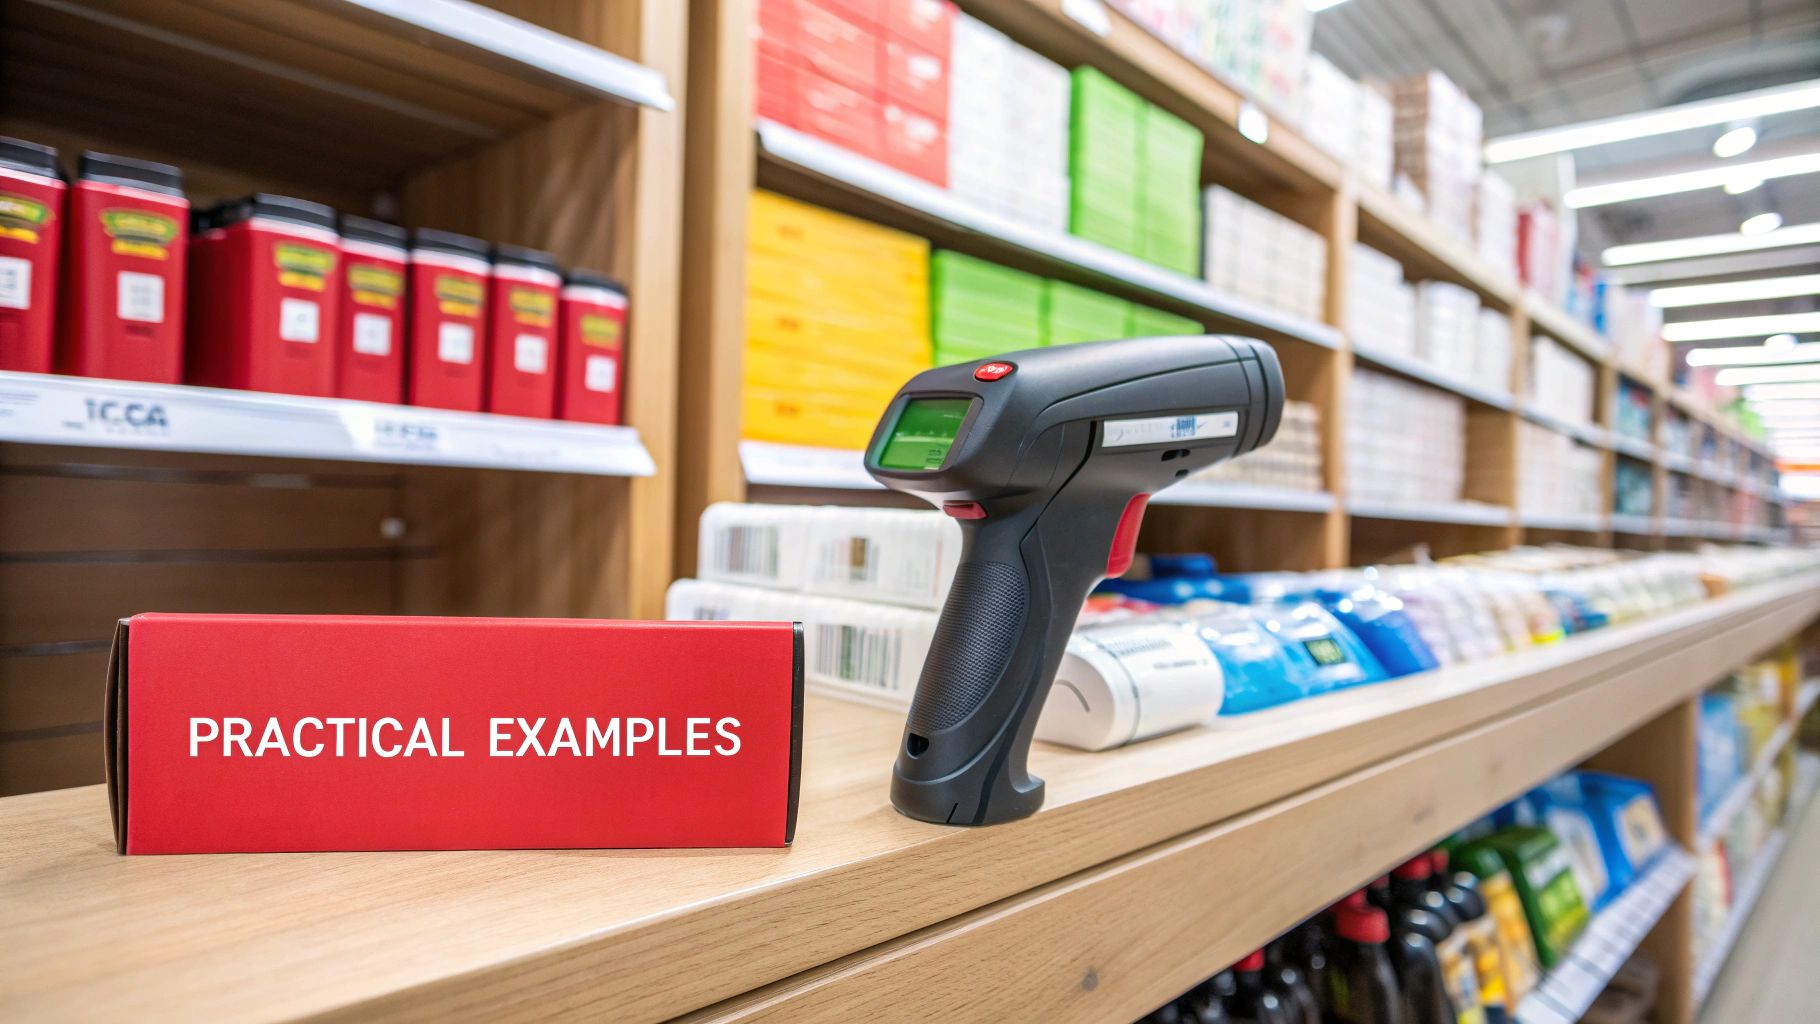
So, you've run the numbers and your inventory turnover ratio is lower than you'd like. Don't panic. Think of it as a clear signal that it's time to take action. A low ratio is often a sign that too much of your cash is tied up in stock that just isn't moving.
The good news is that this is a metric you can directly influence with a few smart, targeted strategies. The key is to avoid making drastic, across-the-board changes and instead focus on tactics that get to the root of the problem. This is about moving beyond guesswork and using your data to make decisions that actually improve your efficiency and, most importantly, your cash flow.
Refine Your Demand Forecasting
Honestly, the best way to fix a turnover problem is to prevent it in the first place. That starts with buying smarter, which all comes down to accurate demand forecasting. It's time to really dig into your historical sales data. Look for patterns, seasonal spikes and dips, and those products that consistently seem to underperform.
Ask yourself the tough questions. Are you ordering way too much of a certain item during its off-season? Are your shiny new product launches accidentally killing sales of older, but still reliable, stock? Answering these questions helps you line up your purchasing with what your customers actually want, stopping overstock situations before they even begin.
A common mistake I see is treating all products the same. Your forecasting needs to be granular. A top-selling item might need you to look at its data weekly, while a slower-moving, long-tail product can probably be reviewed just once a month.
Strategically Discount Slow-Movers
Every retailer has them—the products that just sit there. These "duds" are absolute inventory turnover killers. They take up precious shelf space and lock up your capital. Instead of letting them collect dust, you need to be decisive.
Here are a few proven tactics:
- Flash Sales: Nothing creates urgency like a limited-time, deep discount on specific items. This is a fantastic way to quickly clear out old stock.
- Product Bundling: This is a classic for a reason. Try pairing a slow-moving product with a popular, fast-selling one. For instance, if you sell electronics, you could bundle an older model of headphones with a newly released gaming console.
- Clearance Section: Dedicate a specific area of your store or a page on your website for final markdowns. This trains customers where to look for great deals and helps you turn obsolete inventory into cash.
Even if you have to sell this stock at a lower margin, you're converting a dead asset back into cash. That's cash you can then reinvest in products that you know will turn over quickly.
Boost Sales Velocity with Marketing
Sometimes, inventory isn't slow-moving because it's a bad product—it just isn't getting the right attention. This is where targeted marketing can make a huge difference, directly boosting your sales velocity and, in turn, your turnover rate.
For example, let's say you notice a particular line of skincare products is lagging. You could launch an email marketing campaign highlighting its unique benefits, or run some social media ads aimed at customers who have bought similar items in the past. This kind of focused effort can reignite interest and get those products flying off the shelves.
Many of these marketing efforts can be streamlined through automation in the retail industry, which helps you run campaigns more effectively and ensures your marketing dollars are directly supporting your inventory goals.
By combining smarter purchasing, strategic markdowns, and targeted sales initiatives, you can systematically improve your inventory turnover. Each of these tactics helps you sell through stock more efficiently, which is the ultimate goal of any inventory turnover ratio calculation.
How Turnover Shapes Your Bottom Line
Your inventory turnover ratio is much more than just a number for your operations team to track. It's a direct line to your profitability, telling a story about your cash flow, hidden costs, and the overall financial health of your retail business.
A high turnover rate is like a strong pulse for your company's finances. Every time you sell through your stock, you’re turning a sunk cost back into liquid cash. This cycle pumps essential working capital back into your business, giving you the freedom to invest in marketing, grab new opportunities, or stock up on the next big thing. Slow turnover, on the other hand, means your cash is literally stuck sitting on a shelf.
From Turnover Ratio to Days on Hand
To really bring this concept to life, I always recommend calculating your Days Sales of Inventory (DSI), sometimes called Days Inventory Outstanding (DIO). It’s a simple but powerful calculation that tells you exactly how many days, on average, a product sits around before someone buys it.
Here’s the quick formula:
DSI = 365 / Inventory Turnover Ratio
Let’s say your annual turnover ratio is 5. Your DSI would be 73 (365 divided by 5). That means, on average, your inventory collects dust for 73 days before it becomes a sale. Seeing it as a concrete number of days makes the abstract idea of "turnover" much easier to manage and improve.
We saw this play out in a big way globally. Back in 2020, with all the logistics chaos, many U.S. e-commerce brands actually saw their turnover spike. But as things started getting back to normal, turnover rates fell by 22% in 2021. That shift meant products sat in warehouses longer, tying up cash that retailers desperately needed. You can find more details on these inventory KPI trends on ShipBob.com.
The Hidden Costs Quietly Draining Your Profits
Slow-moving inventory doesn't just trap your cash; it actively costs you money every single day. We call these carrying costs, and they can be silent profit killers if you’re not paying attention.
I always tell my clients to think of unsold inventory as a guest that overstays its welcome. It's not just taking up space—you're paying for its food and lodging through storage fees, insurance, and the risk that it will become worthless.
These costs creep in from all over the place:
- Storage and Warehousing Fees: You pay for every square foot your products take up.
- Insurance: The more stuff you have, the higher your insurance premiums.
- Spoilage and Obsolescence: Food expires, fashion goes out of style, and tech becomes outdated.
- Labor Costs: More inventory means more people needed to count, move, and manage it.
Believe it or not, these expenses can easily add up to 20-30% of your inventory's value over a year. When you improve your turnover rate, you directly slash these carrying costs, and that money goes straight back into your pocket. Getting this right can even inform bigger decisions, like whether the cost of adopting new technologies like electronic shelf tags is justified by the efficiency gains. Mastering your inventory turnover ratio calculation is the first real step to plugging these financial leaks.
Let's Clear Up Some Common Questions
Even when you've got the formula down, a few tricky questions always seem to pop up when it's time to actually calculate your inventory turnover. Nailing these details is what separates a useless number from a truly powerful business insight. Let’s walk through the most common sticking points so you can feel confident in your analysis.
Getting these right helps you avoid the little mistakes that can throw off your entire strategy and lead to some seriously flawed decisions down the road.
Revenue or COGS? The Definitive Answer
This is probably the number one mistake I see people make, and the answer is non-negotiable: always, always use Cost of Goods Sold (COGS).
It’s easy to get tempted by your total sales revenue—it's a bigger, more impressive number. But here's the problem: revenue includes your profit margin. Using it inflates your turnover ratio and gives you a completely distorted view of how efficiently you're actually moving products.
The whole point of this calculation is to compare what you paid for your inventory against the cost of the specific goods you sold. It's a true cost-to-cost comparison that gives you an honest, unvarnished look at your operational health, stripping away all the noise from pricing strategies and markups.
How Often Should I Run This Calculation?
There’s no one-size-fits-all answer here; it really comes down to the rhythm of your business and industry. The most important thing isn't the frequency itself, but being consistent so you can make meaningful comparisons over time.
- For fast-moving businesses: Think of a busy coffee shop or an online fashion boutique dropping new styles weekly. Calculating monthly or even quarterly is smart. It helps you catch trends as they're happening and adjust on the fly.
- For businesses with longer sales cycles: If you’re selling furniture or cars—big-ticket items people spend a lot of time thinking about—an annual or semi-annual calculation will probably give you all the data you need.
Remember, a single calculation is just a snapshot in time. What you're really looking for is the trend. Tracking it over time is like watching a movie of your business—it shows you exactly where you're headed.
Is a Super High Turnover Rate Always a Good Thing?
Not always. It’s a classic case of "too much of a good thing." While a high turnover rate usually signals strong sales and healthy demand, an extremely high ratio can be a major red flag.
If your number is off the charts, it might mean your inventory levels are dangerously thin. You could be living on the edge of a stockout, which leads to lost sales and frustrated customers who can't get what they came for. The goal is to find that sweet spot—a balance that keeps sales humming without constantly running out of stock.
Ultimately, a perfect inventory turnover ratio calculation isn't about moving products as fast as humanly possible. It's about finding the optimal stock level for your business.
Ready to get your inventory flowing smoothly and boost that bottom line? With advanced digital price tags from ESLtags, you get real-time control over pricing and promos, helping you move stock with precision and dial in your turnover rate. Discover our electronic shelf label solutions and see how we can transform your retail operations.


Leave a Reply
Your email is safe with us.